Veusz is a free and open source scientific plotting package used to create awesome publication ready plots.
Veusz Features
Veusz is written in Qt, Python, PyQt, NumPy. It has capability to create quality plots in vector formats with supported file formats such as PDF, PostScript and SVG. The UI contains series of plotting widgets including “X-Y plots, functions, contours, box plots, polar plots, ternary plots, vector plots, data images, labels and a variety of shapes”. Multiple types of plotting widgets can be used together in a single drawing to create complex diagrams.
Datasets can be edited, modified according to user need and functions can also be injected into the datasets. Popular dataset standards are supported – CSV, HDF5, FITS.
You can also extend its functionalities using plugins and automate operations. It supports command line and scripting interface for Python which creates Python text script which can fed to its plotting features.
That’s not all, there are many more features available, which you can read at official home page. For learning, the home page contains manuals, video tutorials, Wiki and a FAQ.
Screenshots
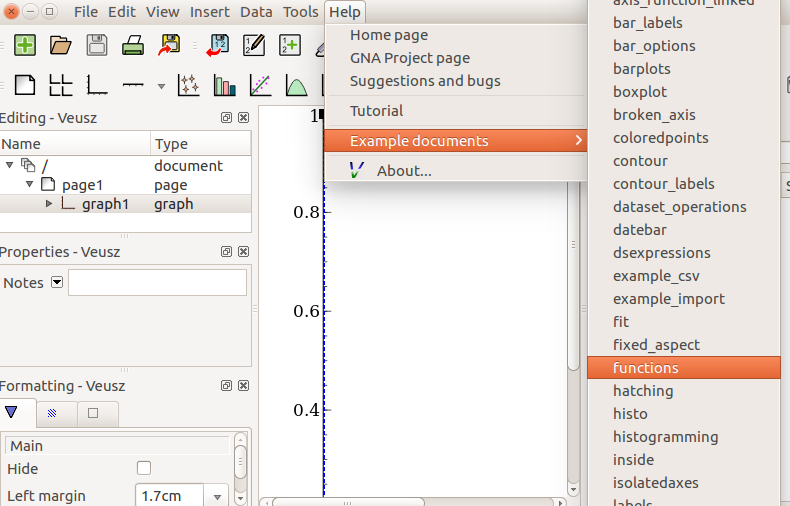
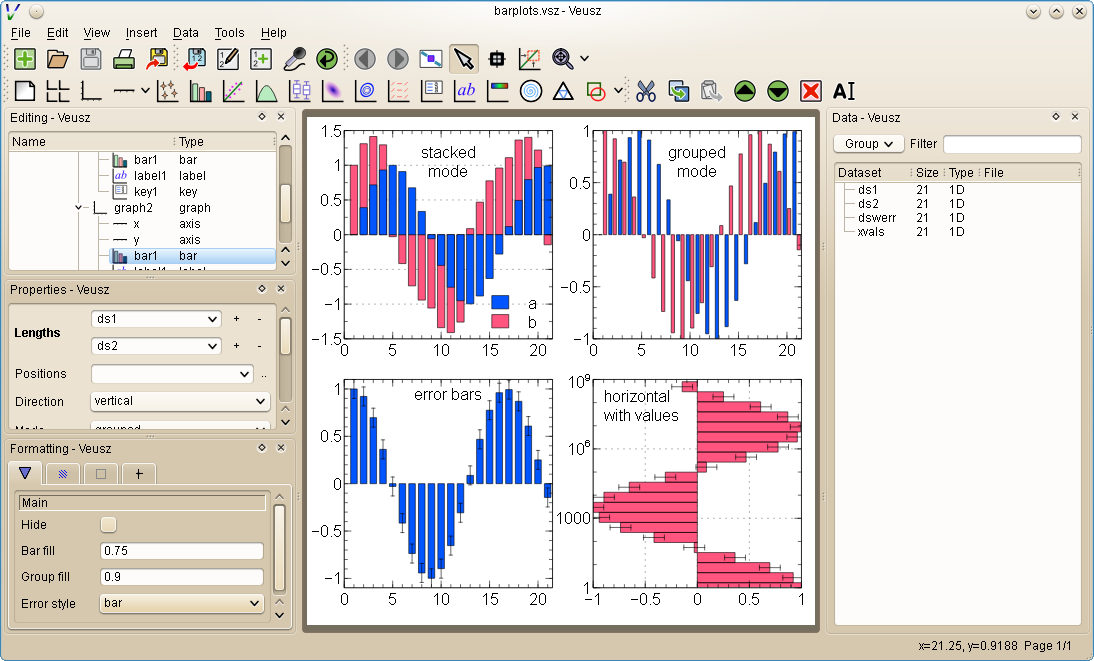
You can take a look at more screenshots here.
How to Install
There is an official PPA available for Veusz. Run below commands from terminal to install Veusz in Ubuntu, Linux Mint.
Note: Latest version of Veusz is 1.23.2, however it’s not yet available in PPA. The prior version 1.23.1 is available in PPA.
sudo add-apt-repository ppa:jeremysanders/ppa
sudo apt-get update
sudo apt-get install veusz
Drop a comment if you are facing problem installing Veusz or found any bugs.


